Market Outlook
September 19, 2016
Market Cues
Domestic Indices
Chg (%)
(Pts)
(Close)
Indian markets are likely to open on a flat note considering global cues.
BSE Sensex
0.7
186
28,599
Nifty
0.4
37
8,780
US markets lost ground on Friday but closed positive for the week. Investors cut
Mid Cap
(0.3)
(42)
13,051
positions due to negative sentiment from higher than expected consumer prices for
Small Cap
0.1
19
12,765
the month of August. Gold and airline indices were the losers for the session,
posting losses of around 2% and 1.9% respectively.
Bankex
(0.0)
(1)
22,735
European markets closed lower on Friday after financial closed sharply lower for the
Global Indices
Chg (%)
(Pts)
(Close)
day. Deutsche Bank fell nearly 8% after news that the US Department of Justice
would fine the bank $3.4 bn due to its role in mis-selling mortgage backed
Dow Jones
(0.5)
(89)
18,124
securities. Royal Bank of Scotland (RBS) dropped nearly 4.6% to make it the FTSE’s
Nasdaq
(0.1)
(5)
5,245
biggest faller, while Barclays (BARC) and Standard Chartered (STAN) both fell 2.5%.
FTSE
(0.3)
(20)
6,710
Indian markets closed higher for a third consecutive session on Friday. Most sectoral
Nikkei
0.7
114
16,519
indices closed higher at the end of the session, with the metal index being the only
Hang Seng
0.6
145
23,336
major loser. Inflation for the month of August also came in at 5.1% vs 6.1% MoM,
Shanghai Com
(0.7)
(21)
3,003
which helped raise investor sentiment.
News Analysis
Advances / Declines
BSE
NSE
Dr Reddy’s to market three more drugs by Amgen in India
Advances
1,306
747
Mahanagar Gas Raigad project to generate revenue by FY18
Declines
1,452
875
Detailed analysis on Pg2
Unchanged
194
77
Investor’s Ready Reckoner
Key Domestic & Global Indicators
Volumes (` Cr)
Stock Watch: Latest investment recommendations on 150+ stocks
BSE
4,507
Refer Pg5 onwards
NSE
31,679
Top Picks
Net Inflows (` Cr)
Net
Mtd
Ytd
CMP
Target
Upside
Company
Sector
Rating
(`)
(`)
(%)
FII
346
1,199
41,868
Amara Raja Batteries Auto & Auto Ancillary
Buy
1,004
1,174
17.0
MFs
(185)
(840)
9,269
HCL Tech
IT
Buy
785
1,000
27.4
Bharat Electronics
Capital Goods
Buy
1,212
1,414
16.7
Equitas Holdings
Financials
Buy
180
235
30.5
Top Gainers
Price (`)
Chg (%)
Navkar Corporation Others
Buy
200
265
32.7
Wockpharma
909
8.3
More Top Picks on Pg3
Thermax
890
8.1
Prestige
198
7.9
Key Upcoming Events
Previous
Consensus
Den
78
7.8
Date
Region
Event Description
Reading
Expectations
Get&D
345
6.3
Sep 20 US
Housing Starts
1,211.00
1,190.00
Sep 20 US
Building permits
1,144.00
1,164.00
Sep 21 US
Initial Jobless claims
260.00
261.00
Top Losers
Price (`)
Chg (%)
Sep 22 US
FOMC rate decision
0.50
0.50
Ucobank
38
(7.6)
Sep 22 Euro Zone
Euro-Zone Consumer Confidence
(8.50)
(8.20)
Polaris
171
(7.3)
Sep 22 Germany
PMI Manufacturing
53.60
53.10
Jppower
4
(7.3)
Sep 23 US
Existing home sales
5.39
5.45
Punjlloyd
25
(6.0)
Sep 23 Germany
PMI Services
51.70
52.20
6.(
More Events on Pg4
Gdl
258
(5.5)
As on September 16, 2016
Market Outlook
September 19, 2016
News Analysis
Dr Reddy’s to market three more drugs by Amgen in India
Dr Reddy's Laboratories (DRL) Limited announced that it has expanded its strategic
collaboration with Amgen, one of the world's leading independent biotechnology
companies. This expanded collaboration will allow DRL to market and distribute
three of Amgen's medicines in India. These drugs are therapeutic in nature and
focusing on the treatment of cancer and osteoporosis. Under the terms of
collaboration, Dr Reddy's will be marketing and distributing XGeva (denosumab),
Vectibix (panitumumab) and Prolia (denosumab) in the country.
The company said that this collaboration with Amgen strengthens the company’s
efforts to enhance successful treatment of patients, through novel treatment options
across therapy areas. The company also stated that these medicines will provide
unique treatment options to physicians to address unmet medical needs in the
areas of oncology and osteoporosis.
Mahanagar Gas Raigad project to generate revenue by FY18
Mahanagar Gas Ltd (MGL) is expanding beyond Mumbai with its Raigad gas
distribution project. MGL won the Raigad district project under the fourth round of
Petroleum and Natural Gas Regulatory Board (PNGRB) bidding in 2015 and is
likely to start operations in the next financial year.
MGL will execute the Raigad project for a total capital expenditure of `50-100cr
annually for 4-5 years time. The company expects the Raigad project to see a
demand of about 0.5 million cubic metres per year of gas. This compares to a
demand of 2.5-2.8 million cubic metres seen by the company in the Mumbai
region at present.
MGL, also said that it is keen to further expand in two more cities in India and is
open to collaborating with other smaller city gas providers to execute similar
projects.
Economic and Political News
Centre decides that the Minimum Support Prices (MSPs) for Kharif Crops
grown in 2016 will be applicable from 1st September, 2016
India loses appeal in WTO ruling regarding mandatory domestic content
requirement of solar power developers
CEA Panel recommends raising of Minimum Support Price (MSP) on Pulses
and raising of export ban
Corporate News
GMR Infra seeks restraining orders against JV partner Menzies
ICICI Prudential raises `1,635cr from anchor investors
IDBI Bank plans to raise about `6,000cr through share sale
Mahindra CIE acquires Bill Forge for `1,331cr
Market Outlook
September 19, 2016
Top Picks ★★★★★
Large Cap
Market Cap
CMP
Target
Upside
Company
Rationale
(` Cr)
(`)
(`)
(%)
To outpace battery industry growth due to better technological
Amara Raja Batteries
17,144
1,004
1,174
17.0
products leading to market share gains in both the
automotive OEM and replacement segments.
Uptick in defense capex by government when coupled with
Bharat Electronics
29,086
1,212
1,414
16.7
BELs strong market positioning, indicate that good times are
ahead for BEL.
The stock is trading at attractive valuations and is factoring all
HCL Tech
1,10,730
785
1,000
27.4
the bad news.
Back on the growth trend, expect a long term growth of 14%
Infosys
2,43,557
1,060
1,370
29.2
to be a US$20bn in FY2020.
Source: Company, Angel Research
Mid Cap
Market Cap
CMP
Target
Upside
Company
Rationale
(` Cr)
(`)
(`)
(%)
Among the top 4 players in the consumer durables segment.
Bajaj Electricals
2,677
265
306
15.6
Improved profitability backed by turn around in E&P
segment. Strong order book lends earnings visibility.
Favourable outlook for the AC industry to augur well for
Cooling products business which is out pacing the market
Blue Star
4,931
517
578
11.7
growth. EMPPAC division's profitability to improve once
operating environment turns around.
With a focus on the low and medium income (LMI) consumer
Dewan Housing Finance
8,200
281
325
15.7
segment, the company has increased its presence in tier-II &
III cities where the growth opportunity is immense.
Strong loan growth backed by diversified loan portfolio and
adequate CAR. ROE & ROA likely to remain decent as risk of
Equitas Holdings
6,040
180
235
30.5
dilution remains low. Attractive valuations considering
growth.
Expectations of above average monsoon augurs well for
Goodyear India
1,433
621
684
10.1
Goodyear India as it derives ~50% of its turnover from farm
tyre segment.
Economic recovery to have favourable impact on advertising
& circulation revenue growth. Further, the acquisition of a
Jagran Prakashan
6,246
191
225
17.8
radio business (Radio City) would also boost the company's
revenue growth.
Speedier execution and speedier sales, strong revenue
Mahindra Lifespace
1,772
432
522
20.8
visibilty in short-to-long run, attractive valuations
Massive capacity expansion along with rail advantage at ICD
Navkar Corporation
2,848
200
265
32.7
as well CFS augurs well for the company
Earnings boost on back of stable material prices and
Radico Khaitan
1,441
108
125
15.4
favourable pricing environment. Valuation discount to peers
provides additional comfort
Strong brands and distribution network would boost growth
Siyaram Silk Mills
1,154
1,231
1,469
19.3
going ahead. Stock currently trades at an inexpensive
valuation.
Market leadership in Hindi news genre and no. 2 viewership
ranking in English news genre, exit from the radio business,
TV Today Network
1,803
302
363
20.1
and anticipated growth in ad spends by corporates to benefit
the stock.
Source: Company, Angel Research
Market Outlook
September 19, 2016
Key Upcoming Events
Global economic events release calendar
Bloomberg Data
Date
Time
Country
Event Description
Unit
Period
Last Reported
Estimated
Sep 20, 2016
6:00 PM
US
Housing Starts
Thousands
Aug
1,211.00
1,190.00
6:00 PM
US
Building permits
Thousands
Aug
1,144.00
1,164.00
Sep 21, 2016
6:00 PM
US
Initial Jobless claims
Thousands
Sep 17
260.00
261.00
Sep 22, 2016
11:30 PM
US
FOMC rate decision
%
Sep 21
0.50
0.50
7:30 PM Euro Zone Euro-Zone Consumer Confidence
Value Sep A
(8.50)
(8.20)
1:00 PM
Germany
PMI Manufacturing
Value Sep P
53.60
53.10
Sep 23, 2016
7:30 PM
US
Existing home sales
Million
Aug
5.39
5.45
1:00 PM
Germany
PMI Services
Value Sep P
51.70
52.20
Sep 26, 2016
7:30 PM
US
New home sales
Thousands
Aug
654.00
580.00
Sep 27, 2016
7:30 PM
US
Consumer ConfidenceS.A./ 1985=100
Sep
101.10
98.50
Sep 29, 2016
1:25 PM
Germany Unemployment change (000's)
Thousands
Sep
(7.00)
6:00 PM
US
GDP Qoq (Annualised)
% Change 2Q T
1.10
1.60
Sep 30, 2016
2:00 PM
UK
GDP (YoY)
% Change 2Q F
2.20
Oct 01, 2016
6:30 AM
China
PMI Manufacturing
Value
Sep
50.40
Oct 03, 2016
2:00 PM
UK
PMI Manufacturing
Value
Sep
53.30
Oct 04, 2016 11:00 AM
India
RBI Reverse Repo rate
% Oct 4
6.00
11:00 AM
India
RBI Repo rate
% Oct 4
6.50
2:00 PM
UK
Industrial Production (YoY)
% Change
Aug
2.10
Oct 07, 2016
11:00 AM
India
RBI Cash Reserve ratio
% Oct 4
4.00
6:00 PM
US
Change in Nonfarm payrolls
Thousands
Sep
151.00
173.00
6:00 PM
US
Unnemployment rate
% Sep
4.90
4.90
Source: Bloomberg, Angel Research
Market Outlook
September 19, 2016
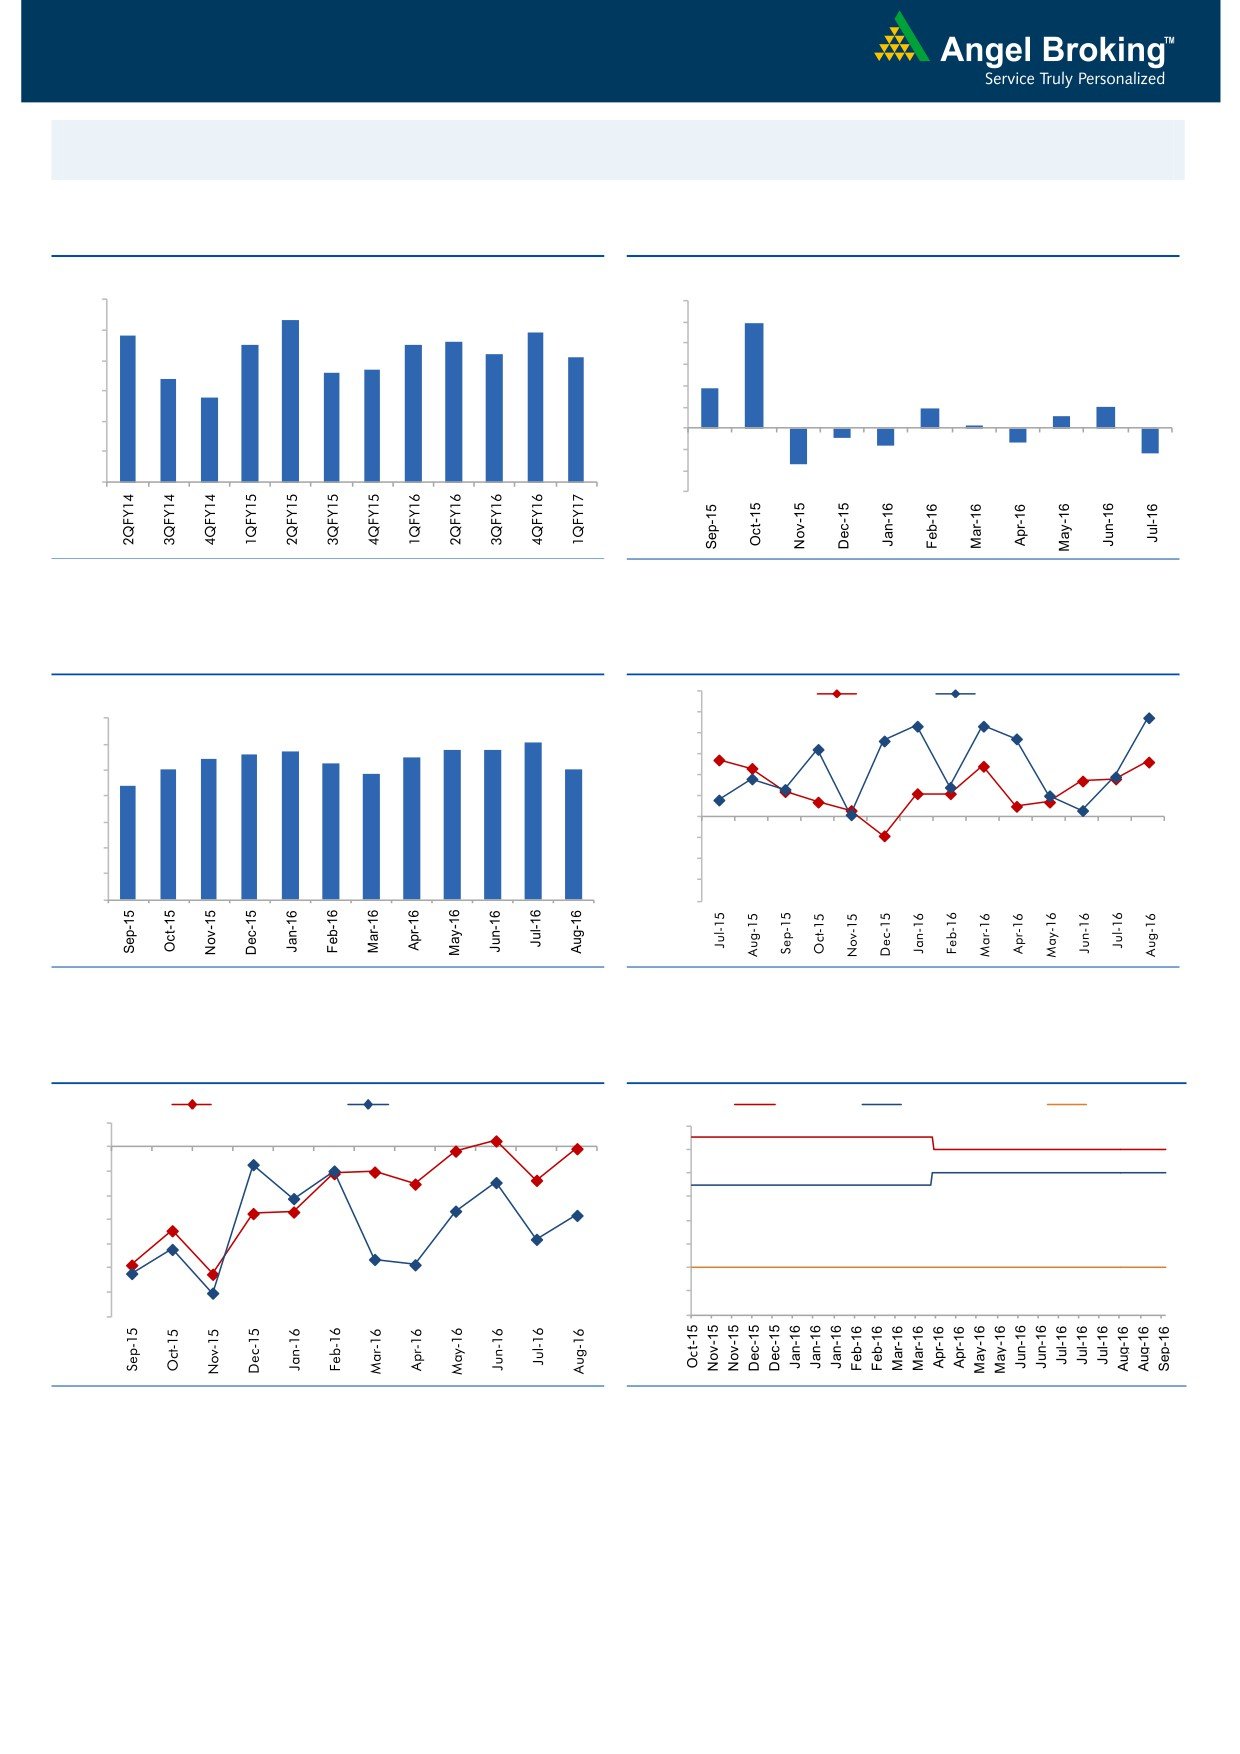
Macro watch
Exhibit 1: Quarterly GDP trends
Exhibit 2: IIP trends
(%)
(%)
9.0
12.0
8.3
9.9
7.8
7.9
8.0
7.5
7.5
7.6
10.0
7.2
7.1
8.0
6.6
6.7
7.0
6.4
6.0
3.7
5.8
6.0
4.0
1.9
2.0
1.1
2.0
0.3
5.0
-
4.0
(2.0)
(0.9)
(1.3)
(1.6)
(4.0)
(2.4)
3.0
(3.4)
(6.0)
Source: CSO, Angel Research
Source: MOSPI, Angel Research
Exhibit 3: Monthly CPI inflation trends
Exhibit 4: Manufacturing and services PMI
56.0
Mfg. PMI
Services PMI
(%)
55.0
7.0
6.1
5.7
5.8
5.8
54.0
6.0
5.4
5.6
5.5
5.0
5.3
5.1
53.0
4.8
5.0
4.4
52.0
4.0
51.0
50.0
3.0
49.0
2.0
48.0
1.0
47.0
-
46.0
Source: MOSPI, Angel Research
Source: Market, Angel Research; Note: Level above 50 indicates expansion
Exhibit 5: Exports and imports growth trends
Exhibit 6: Key policy rates
(%)
Exports yoy growth
Imports yoy growth
(%)
Repo rate
Reverse Repo rate
CRR
5.0
7.00
0.0
6.50
(5.0)
6.00
(10.0)
5.50
(15.0)
5.00
(20.0)
4.50
(25.0)
4.00
(30.0)
3.50
(35.0)
3.00
Source: Bloomberg, Angel Research
Source: RBI, Angel Research
Market Outlook
September 19, 2016
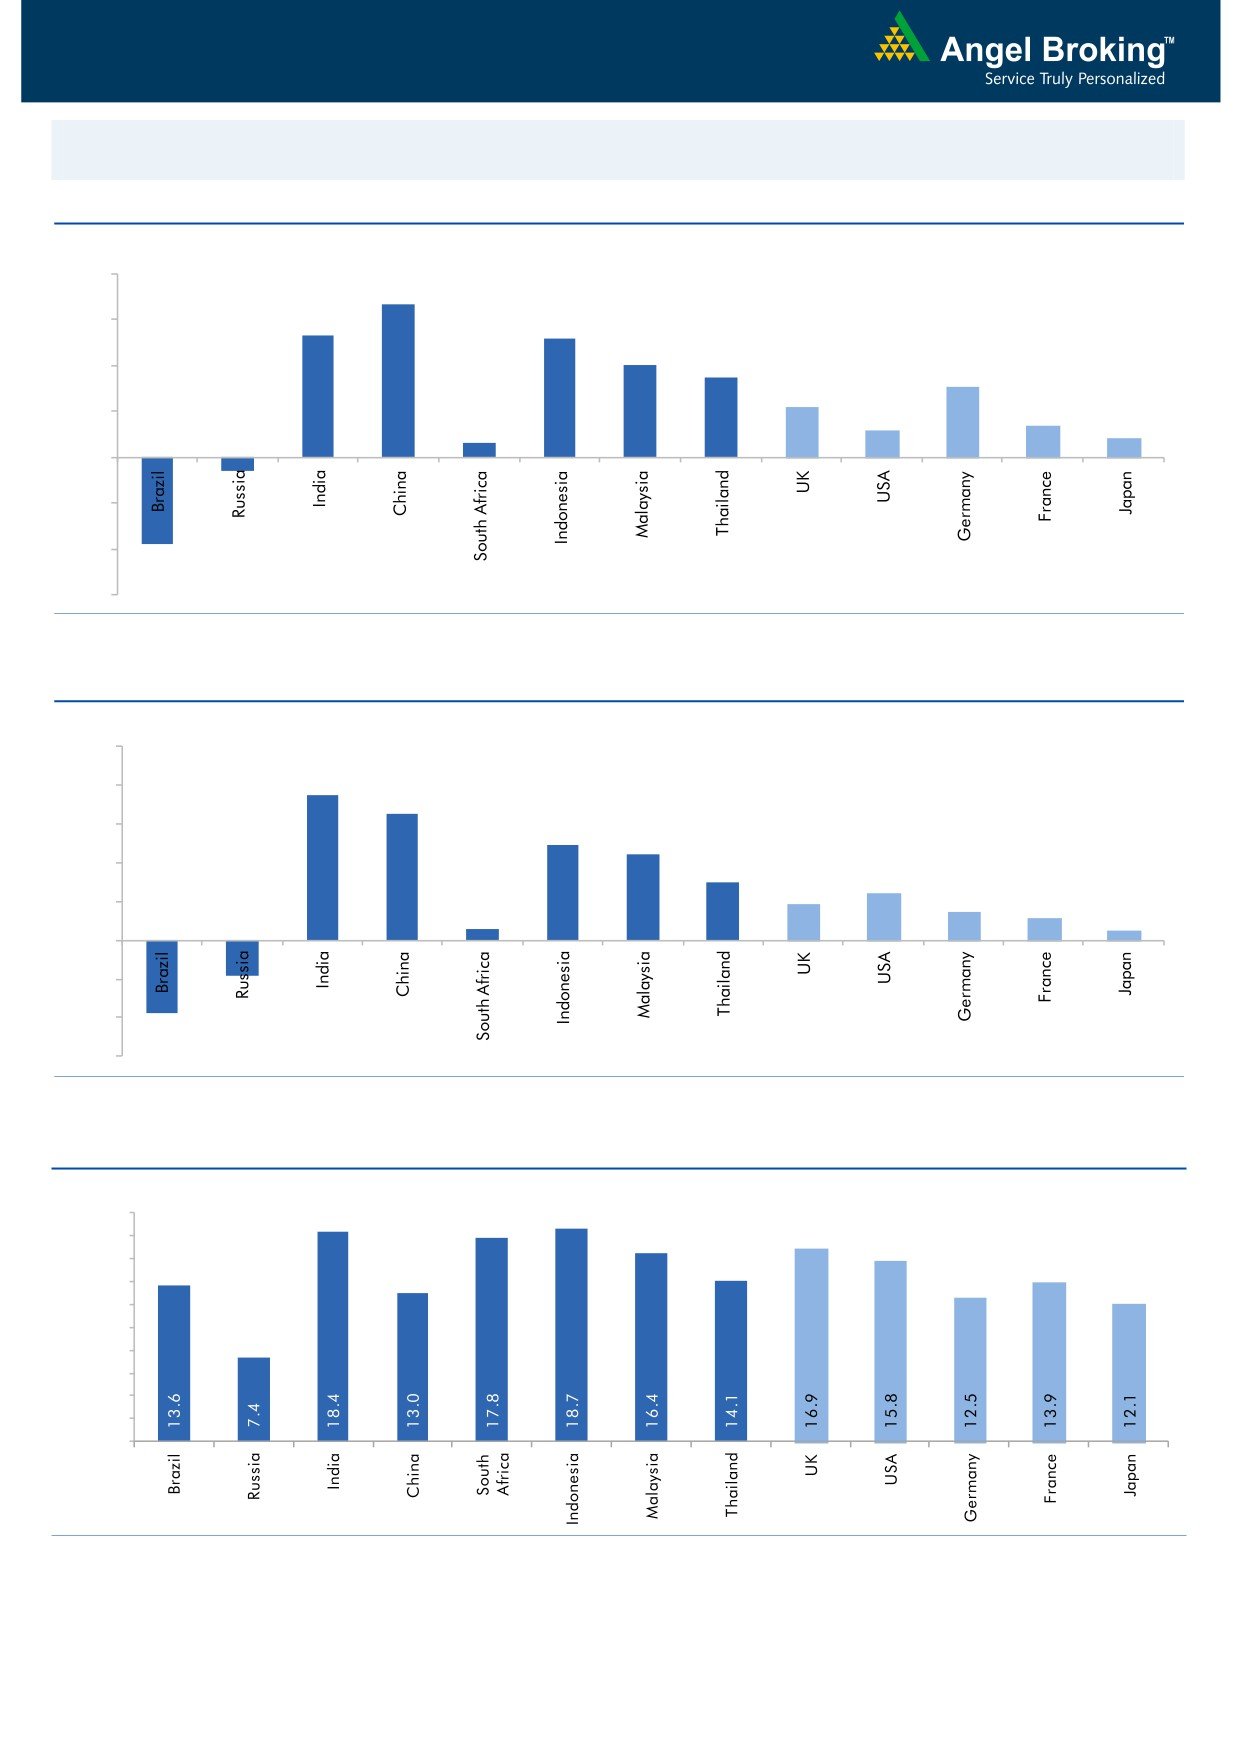
Global watch
Exhibit 1: Latest quarterly GDP Growth (%, yoy) across select developing and developed countries
(%)
8.0
6.7
6.0
5.3
0.6
5.2
4.0
3.5
4.0
3.1
2.2
1.4
2.0
1.2
0.8
-
(2.0)
(0.6)
(4.0)
(3.8)
(6.0)
Source: Bloomberg, Angel Research
Exhibit 2: 2016 GDP Growth projection by IMF (%, yoy) across select developing and developed countries
(%)
10.0
7.5
8.0
6.5
6.0
4.9
4.4
4.0
3.0
2.4
1.9
1.5
2.0
1.1
0.6
0.5
(3.8)
(1.8)
-
(2.0)
(4.0)
(6.0)
Source: IMF, Angel Research
Exhibit 3: One year forward P-E ratio across select developing and developed countries
(x)
20.0
18.0
16.0
14.0
12.0
10.0
8.0
6.0
4.0
2.0
-
Source: IMF, Angel Research
Market Outlook
September 19, 2016
Exhibit 4: Relative performance of indices across globe
Returns (%)
Country
Name of index
Closing price
1M
3M
1YR
Brazil
Bovespa
57,080
(3.0)
15.2
23.0
Russia
Micex
1,982
0.6
4.2
14.4
India
Nifty
8,780
1.2
8.3
16.2
China
Shanghai Composite
3,003
(3.9)
4.5
(5.3)
South Africa
Top 40
45,430
0.1
(1.3)
3.3
Mexico
Mexbol
45,923
(5.0)
1.4
5.4
Indonesia
LQ45
908
(0.5)
8.7
21.0
Malaysia
KLCI
1,653
(1.9)
0.7
4.4
Thailand
SET 50
944
(3.4)
4.1
5.8
USA
Dow Jones
18,124
(2.3)
2.2
10.6
UK
FTSE
6,710
(3.0)
13.1
10.3
Japan
Nikkei
16,519
(1.2)
3.0
(7.8)
Germany
DAX
10,276
(2.5)
3.2
7.4
France
CAC
4,332
(1.9)
(0.2)
(3.3)
Source: Bloomberg, Angel Research
Stock Watch
September 19, 2016
Company Name
Reco
CMP
Target
Mkt Cap
Sales ( Čcr )
OPM(%)
EPS (Č)
PER(x)
P/BV(x)
RoE(%)
EV/Sales(x)
(Č)
Price ( Č)
( Č cr )
FY17E FY18E
FY17E
FY18E
FY17E
FY18E
FY17E
FY18E
FY17E
FY18E
FY17E
FY18E
FY17E
FY18E
Agri / Agri Chemical
Rallis
Neutral
215
-
4,174
1,937
2,164
13.3
14.3
9.0
11.0
23.9
19.5
4.2
3.6
18.4
19.8
2.2
2.0
United Phosphorus
Accumulate
692
684
35,056
15,176
17,604
18.5
18.5
37.4
44.6
18.5
15.5
3.6
3.0
21.4
21.2
2.3
1.9
Auto & Auto Ancillary
Ashok Leyland
Buy
81
111
23,037
22,407
26,022
10.6
10.6
5.2
6.4
15.5
12.6
3.5
3.0
23.6
24.7
1.1
1.0
Bajaj Auto
Neutral
2,980
-
86,231
25,093
27,891
19.5
19.2
143.9
162.5
20.7
18.3
5.8
5.0
30.3
29.4
3.1
2.7
Bharat Forge
Neutral
875
-
20,380
7,726
8,713
20.5
21.2
35.3
42.7
24.8
20.5
4.6
4.1
18.9
20.1
2.6
2.3
Eicher Motors
Neutral
23,135
-
62,838
16,583
20,447
17.5
18.0
598.0
745.2
38.7
31.1
13.2
10.1
41.2
38.3
3.6
2.8
Gabriel India
Neutral
115
-
1,656
1,544
1,715
9.0
9.3
5.4
6.3
21.4
18.3
4.0
3.6
18.9
19.5
1.0
0.9
Hero Motocorp
Neutral
3,585
-
71,591
31,253
35,198
15.3
15.0
172.3
192.1
20.8
18.7
7.6
6.5
38.9
37.0
2.1
1.9
Jamna Auto Industries Neutral
214
-
1,711
1,486
1,620
9.8
9.9
15.0
17.2
14.3
12.5
3.1
2.6
21.8
21.3
1.2
1.1
L G Balakrishnan & Bros Neutral
580
-
910
1,302
1,432
11.6
11.9
43.7
53.0
13.3
10.9
1.9
1.7
13.8
14.2
0.7
0.7
Mahindra and Mahindra Neutral
1,408
-
87,472
46,534
53,077
11.6
11.7
67.3
78.1
20.9
18.0
3.4
3.0
15.4
15.8
1.9
1.6
Maruti
Neutral
5,566
-
168,136
69,186
82,217
14.7
14.4
198.5
241.4
28.0
23.1
5.5
4.4
20.2
20.0
2.0
1.6
Minda Industries
Neutral
307
-
2,438
2,728
3,042
9.0
9.1
68.2
86.2
4.5
3.6
1.0
0.8
23.8
24.3
0.9
0.8
Motherson Sumi
Neutral
319
-
42,136
45,896
53,687
7.8
8.3
13.0
16.1
24.4
19.8
7.9
6.3
34.7
35.4
1.0
0.8
Rane Brake Lining
Neutral
1,311
-
1,037
511
562
11.3
11.5
28.1
30.9
46.6
42.4
7.1
6.5
15.3
15.0
2.0
1.9
Setco Automotive
Neutral
44
-
588
741
837
13.0
13.0
15.2
17.0
2.9
2.6
0.5
0.4
15.8
16.3
1.2
1.1
Tata Motors
Neutral
549
-
158,479
300,209
338,549
8.9
8.4
42.7
54.3
12.9
10.1
2.1
1.7
15.6
17.2
0.6
0.6
TVS Motor
Neutral
338
-
16,063
13,390
15,948
6.9
7.1
12.8
16.5
26.5
20.4
6.6
5.2
26.3
27.2
1.2
1.0
Amara Raja Batteries
Buy
1,004
1,174
17,144
5,429
6,471
17.5
17.6
35.3
43.5
28.4
23.1
6.5
5.3
25.3
24.8
3.0
2.4
Exide Industries
Neutral
193
-
16,401
7,439
8,307
15.0
15.0
8.1
9.3
23.8
20.8
3.3
3.0
14.3
16.7
1.7
1.5
Apollo Tyres
Neutral
213
-
10,858
12,877
14,504
14.3
13.9
21.4
23.0
10.0
9.3
1.6
1.3
16.4
15.2
1.0
0.9
Ceat
Accumulate
1,064
1,119
4,304
7,524
8,624
13.0
12.7
131.1
144.3
8.1
7.4
1.5
1.3
19.8
18.6
0.6
0.5
JK Tyres
Neutral
146
-
3,314
7,455
8,056
15.0
15.0
21.8
24.5
6.7
6.0
1.4
1.1
22.8
21.3
0.5
0.5
Swaraj Engines
Neutral
1,197
-
1,487
660
810
15.2
16.4
54.5
72.8
22.0
16.4
6.8
6.2
31.5
39.2
2.1
1.7
Subros
Neutral
138
-
828
1,488
1,681
11.7
11.9
6.4
7.2
21.6
19.3
2.3
2.1
10.8
11.4
0.8
0.7
Indag Rubber
Neutral
178
-
468
286
326
19.8
16.8
11.7
13.3
15.2
13.4
2.6
2.4
17.8
17.1
1.3
1.1
Capital Goods
ACE
Neutral
43
-
423
709
814
4.1
4.6
1.4
2.1
30.6
20.4
1.3
1.2
4.4
6.0
0.8
0.7
BEML
Accumulate
921
1,157
3,834
3,451
4,055
6.3
9.2
31.4
57.9
29.3
15.9
1.8
1.6
6.3
10.9
1.4
1.2
Bharat Electronics
Buy
1,212
1,414
29,086
8,137
9,169
16.8
17.2
58.7
62.5
20.7
19.4
3.2
2.8
44.6
46.3
2.5
2.3
Stock Watch
September 19, 2016
Company Name
Reco
CMP
Target
Mkt Cap
Sales ( Čcr )
OPM(%)
EPS (Č)
PER(x)
P/BV(x)
RoE(%)
EV/Sales(x)
(Č)
Price ( Č)
( Č cr )
FY17E
FY18E
FY17E
FY18E
FY17E
FY18E
FY17E
FY18E
FY17E
FY18E
FY17E
FY18E
FY17E
FY18E
Capital Goods
Voltas
Accumulate
379
407
12,529
6,511
7,514
7.9
8.7
12.9
16.3
29.4
23.2
5.3
4.6
16.7
18.5
1.7
1.4
BGR Energy
Neutral
115
-
827
16,567
33,848
6.0
5.6
7.8
5.9
14.7
19.4
0.8
0.8
4.7
4.2
0.2
0.1
BHEL
Neutral
147
-
35,906
28,797
34,742
-
2.8
2.3
6.9
63.8
21.3
1.1
1.1
1.3
4.8
0.9
0.6
Blue Star
Accumulate
517
578
4,931
4,351
5,024
6.4
7.1
17.2
20.6
30.1
25.1
19.6
16.3
23.1
24.1
1.2
1.0
Crompton Greaves
Neutral
81
-
5,061
5,777
6,120
5.9
7.0
3.3
4.5
24.5
17.9
1.1
1.0
4.4
5.9
0.8
0.7
Greaves Cotton
Neutral
134
-
3,278
1,755
1,881
16.8
16.9
7.8
8.5
17.2
15.8
3.4
3.2
20.6
20.9
1.6
1.4
Inox Wind
Buy
199
286
4,417
5,605
6,267
15.7
16.4
24.8
30.0
8.0
6.6
2.2
1.7
25.9
24.4
0.7
0.6
KEC International
Neutral
120
-
3,094
9,294
10,186
7.9
8.1
9.9
11.9
12.2
10.1
1.8
1.6
15.6
16.3
0.6
0.5
Thermax
Neutral
890
-
10,602
5,421
5,940
7.3
7.3
25.7
30.2
34.6
29.5
4.2
3.8
12.2
13.1
1.7
1.6
VATech Wabag
Buy
552
681
3,007
3,136
3,845
8.9
9.1
26.0
35.9
21.2
15.4
2.7
2.3
13.4
15.9
0.9
0.7
Cement
ACC
Neutral
1,627
-
30,559
11,225
13,172
13.2
16.9
44.5
75.5
36.6
21.6
3.5
3.2
11.2
14.2
2.7
2.3
Ambuja Cements
Neutral
263
-
52,123
9,350
10,979
18.2
22.5
5.8
9.5
45.3
27.6
3.8
3.4
10.2
12.5
5.5
4.7
India Cements
Neutral
149
-
4,585
4,364
4,997
18.5
19.2
7.9
11.3
18.9
13.2
1.4
1.3
8.0
8.5
1.8
1.5
JK Cement
Neutral
786
-
5,498
4,398
5,173
15.5
17.5
31.2
55.5
25.2
14.2
3.0
2.6
12.0
15.5
1.8
1.5
J K Lakshmi Cement
Neutral
469
-
5,516
2,913
3,412
14.5
19.5
7.5
22.5
62.5
20.8
3.8
3.2
12.5
18.0
2.4
2.0
Orient Cement
Neutral
205
-
4,198
2,114
2,558
18.5
20.5
8.1
11.3
25.3
18.1
3.7
3.2
9.0
14.0
2.5
2.0
UltraTech Cement
Neutral
3,931
-
107,868
25,768
30,385
21.0
23.5
111.0
160.0
35.4
24.6
4.5
4.0
13.5
15.8
4.2
3.5
Construction
ITNL
Neutral
95
-
3,117
8,946
10,017
31.0
31.6
8.1
9.1
11.7
10.4
0.4
0.4
4.2
5.0
3.7
3.4
KNR Constructions
Buy
699
802
1,965
1,385
1,673
14.7
14.0
41.2
48.5
17.0
14.4
3.2
2.7
14.9
15.2
1.5
1.2
Larsen & Toubro
Buy
1,476
1,700
137,518
67,665
77,249
10.7
11.5
57.3
71.2
25.8
20.7
2.4
2.2
12.6
14.3
2.2
1.9
Gujarat Pipavav Port
Neutral
181
-
8,753
705
788
52.2
51.7
5.0
5.6
36.2
32.3
3.6
3.2
11.2
11.2
12.9
11.0
Nagarjuna Const.
Neutral
88
-
4,873
8,842
9,775
9.1
8.8
5.3
6.4
16.5
13.7
1.3
1.2
8.2
9.1
0.7
0.6
PNC Infratech
Buy
121
143
3,103
2,350
2,904
13.1
13.2
9.0
8.8
13.4
13.7
0.5
0.4
15.9
13.9
1.5
1.2
Simplex Infra
Neutral
331
-
1,639
6,829
7,954
10.5
10.5
31.4
37.4
10.6
8.9
1.1
1.0
9.9
13.4
0.7
0.6
Power Mech Projects
Neutral
479
-
705
1,801
2,219
12.7
14.6
72.1
113.9
6.7
4.2
1.2
1.0
16.8
11.9
0.4
0.3
Sadbhav Engineering
Neutral
302
-
5,172
3,598
4,140
10.3
10.6
9.0
11.9
33.5
25.3
3.5
3.1
9.9
11.9
1.7
1.4
NBCC
Neutral
249
-
14,940
7,428
9,549
7.9
8.6
8.2
11.0
30.4
22.6
1.5
1.2
28.2
28.7
1.7
1.3
MEP Infra
Neutral
43
-
703
1,877
1,943
30.6
29.8
3.0
4.2
14.4
10.3
7.0
4.7
0.6
0.6
1.8
1.6
SIPL
Neutral
106
-
3,742
1,036
1,252
65.5
66.2
(8.4)
(5.6)
4.0
4.5
(22.8)
(15.9)
11.7
9.8
Stock Watch
September 19, 2016
Company Name
Reco
CMP
Target
Mkt Cap
Sales ( Čcr )
OPM(%)
EPS (Č)
PER(x)
P/BV(x)
RoE(%)
EV/Sales(x)
(Č)
Price ( Č)
( Č cr )
FY17E
FY18E
FY17E
FY18E
FY17E
FY18E
FY17E
FY18E
FY17E
FY18E
FY17E
FY18E
FY17E
FY18E
Construction
Engineers India
Neutral
256
-
8,627
1,725
1,935
16.0
19.1
11.4
13.9
22.5
18.4
3.1
3.0
13.4
15.3
3.9
3.5
Financials
Axis Bank
Neutral
601
-
143,480
58,081
66,459
3.5
3.5
32.4
44.6
18.6
13.5
2.5
2.1
13.6
16.5
-
-
Bank of Baroda
Neutral
165
-
38,053
19,980
23,178
1.8
1.8
11.5
17.3
14.4
9.6
1.6
1.4
8.3
10.1
-
-
Canara Bank
Neutral
301
-
16,330
15,225
16,836
1.8
1.8
14.5
28.0
20.7
10.7
1.4
1.2
5.8
8.5
-
-
Dewan Housing Finance Buy
281
325
8,200
2,225
2,688
2.9
2.9
29.7
34.6
9.5
8.1
1.5
1.3
16.1
16.8
-
-
Equitas Holdings
Buy
180
235
6,040
939
1,281
11.7
11.5
5.8
8.2
31.1
22.0
2.7
2.4
10.9
11.5
-
-
Federal Bank
Neutral
72
-
12,431
9,353
10,623
2.9
2.9
4.4
5.8
16.4
12.5
1.6
1.4
9.5
11.0
-
-
HDFC
Neutral
1,400
-
221,390
11,475
13,450
3.4
3.4
45.3
52.5
30.9
26.7
6.0
5.3
20.2
20.5
-
-
HDFC Bank
Accumulate
1,298
1,350
328,633
46,097
55,433
4.5
4.5
58.4
68.0
22.2
19.1
3.9
3.3
18.8
18.6
-
-
ICICI Bank
Neutral
268
-
155,632
39,029
45,903
3.3
3.3
16.7
16.3
16.0
16.4
2.0
1.8
10.1
12.4
-
-
LIC Housing Finance
Neutral
571
-
28,831
3,712
4,293
2.6
2.5
39.0
46.0
14.7
12.4
2.8
2.4
19.9
20.1
-
-
Punjab Natl.Bank
Neutral
138
-
27,068
23,532
23,595
2.3
2.4
6.8
12.6
20.3
10.9
3.1
2.2
3.3
6.5
-
-
RBL Bank
Accumulate
302
325
11,161
1,783
2,309
2.6
2.6
12.7
16.4
23.8
18.4
2.6
2.3
12.8
13.3
-
-
South Ind.Bank
Neutral
24
-
3,193
6,435
7,578
2.5
2.5
2.7
3.1
8.8
7.6
1.1
1.0
10.1
11.2
-
-
St Bk of India
Neutral
254
-
197,485
88,650
98,335
2.6
2.6
13.5
18.8
18.8
13.5
1.8
1.6
7.0
8.5
-
-
Union Bank
Neutral
141
-
9,676
13,450
14,925
2.3
2.3
25.5
34.5
5.5
4.1
0.8
0.7
7.5
10.2
-
-
Yes Bank
Neutral
1,168
-
49,187
8,978
11,281
3.3
3.4
74.0
90.0
15.8
13.0
3.0
2.5
17.0
17.2
-
-
FMCG
Asian Paints
Neutral
1,156
-
110,878
17,128
18,978
16.8
16.4
19.1
20.7
60.5
55.8
21.1
19.9
34.8
35.5
6.4
5.8
Britannia
Neutral
3,478
-
41,731
9,795
11,040
14.6
14.9
80.3
94.0
43.3
37.0
17.8
13.8
41.2
-
4.1
3.5
Colgate
Neutral
968
-
26,320
4,605
5,149
23.4
23.4
23.8
26.9
40.7
36.0
22.5
17.6
64.8
66.8
5.7
5.1
Dabur India
Neutral
293
-
51,508
8,315
9,405
19.8
20.7
8.1
9.2
36.2
31.8
10.1
8.3
31.6
31.0
5.8
5.1
GlaxoSmith Con*
Neutral
6,138
-
25,812
4,350
4,823
21.2
21.4
179.2
196.5
34.3
31.2
9.1
7.7
27.1
26.8
5.3
4.7
Godrej Consumer
Neutral
1,685
-
57,375
10,235
11,428
18.4
18.6
41.1
44.2
41.0
38.1
9.1
7.7
24.9
24.8
5.4
4.8
HUL
Neutral
912
-
197,412
35,252
38,495
17.6
17.4
20.4
21.9
44.7
41.7
36.7
32.2
82.2
77.3
5.5
5.0
ITC
Accumulate
260
283
314,324
40,059
44,439
39.0
39.2
9.1
10.1
28.6
25.8
7.8
6.8
27.2
26.5
7.1
6.4
Marico
Neutral
296
-
38,150
6,430
7,349
18.8
19.5
6.4
7.7
46.2
38.4
14.0
11.7
33.2
32.5
5.6
4.8
Nestle*
Neutral
6,416
-
61,863
10,073
11,807
20.7
21.5
124.8
154.2
51.4
41.6
21.1
19.0
34.8
36.7
6.0
5.1
Tata Global
Neutral
140
-
8,826
8,675
9,088
9.8
9.8
7.4
8.2
18.9
17.1
2.1
2.1
7.9
8.1
0.9
0.8
Procter & Gamble
Accumulate
6,680
7,369
21,684
2,939
3,342
23.2
23.0
146.2
163.7
45.7
40.8
102.3
98.1
25.3
23.5
6.9
6.0
Hygiene
Stock Watch
September 19, 2016
Company Name
Reco
CMP
Target
Mkt Cap
Sales ( Čcr )
OPM(%)
EPS (Č)
PER(x)
P/BV(x)
RoE(%)
EV/Sales(x)
(Č)
Price ( Č)
( Č cr )
FY17E FY18E
FY17E
FY18E
FY17E
FY18E
FY17E
FY18E
FY17E
FY18E
FY17E
FY18E
FY17E
FY18E
IT
HCL Tech^
Buy
785
1,000
110,730
49,242
57,168
20.5
20.5
55.7
64.1
14.1
12.2
2.9
2.2
20.3
17.9
2.1
1.7
Infosys
Buy
1,060
1,370
243,557
69,934
79,025
27.5
27.5
64.8
72.0
16.4
14.7
3.6
3.3
22.0
22.3
2.9
2.5
TCS
Buy
2,361
3,004
465,248
121,684
136,286
27.3
27.3
135.0
150.1
17.5
15.7
5.8
5.3
33.2
33.9
3.6
3.1
Tech Mahindra
Buy
465
700
45,138
30,347
33,685
17.0
17.0
37.5
41.3
12.4
11.3
2.7
2.3
21.8
20.7
1.2
1.0
Wipro
Buy
480
680
116,626
51,631
55,822
21.7
17.9
35.9
36.9
13.4
13.0
2.8
2.6
19.0
18.1
2.0
1.7
Media
D B Corp
Neutral
400
-
7,348
2,297
2,590
27.4
28.2
21.0
23.4
19.0
17.1
4.4
3.8
23.7
23.1
3.0
2.6
HT Media
Neutral
83
-
1,923
2,693
2,991
12.6
12.9
7.9
9.0
10.5
9.2
0.9
0.8
7.8
8.3
0.3
0.2
Jagran Prakashan
Buy
191
225
6,246
2,355
2,635
28.0
28.0
10.8
12.5
17.7
15.3
3.8
3.3
21.7
21.7
2.6
2.3
Sun TV Network
Neutral
495
-
19,493
2,850
3,265
70.1
71.0
26.2
30.4
18.9
16.3
4.8
4.3
24.3
25.6
5.8
5.0
Hindustan Media
Neutral
284
-
2,083
1,016
1,138
24.3
25.2
27.3
30.1
10.4
9.4
2.0
1.8
16.2
15.8
1.4
1.2
Ventures
TV Today Network
Buy
302
363
1,803
637
743
27.5
27.5
18.4
21.4
16.5
14.1
2.9
2.4
17.4
17.2
2.4
2.0
Metals & Mining
Coal India
Neutral
325
-
205,282
84,638
94,297
21.4
22.3
24.5
27.1
13.3
12.0
5.5
5.3
42.6
46.0
2.0
1.8
Hind. Zinc
Neutral
212
-
89,746
14,252
18,465
55.9
48.3
15.8
21.5
13.4
9.9
2.2
1.9
17.0
20.7
6.3
4.9
Hindalco
Neutral
143
-
29,519
107,899
112,095
7.4
8.2
9.2
13.0
15.5
11.0
0.8
0.7
4.8
6.6
0.8
0.7
JSW Steel
Neutral
1,725
-
41,702
53,201
58,779
16.1
16.2
130.6
153.7
13.2
11.2
1.8
1.6
14.0
14.4
1.6
1.3
NMDC
Neutral
101
-
40,202
6,643
7,284
44.4
47.7
7.1
7.7
14.3
13.2
1.2
1.2
8.8
9.2
4.0
3.6
SAIL
Neutral
47
-
19,267
47,528
53,738
(0.7)
2.1
(1.9)
2.6
17.9
0.5
0.5
(1.6)
3.9
1.3
1.2
Vedanta
Neutral
162
-
48,087
71,744
81,944
19.2
21.7
13.4
20.1
12.1
8.1
1.0
0.9
8.4
11.3
1.1
0.8
Tata Steel
Neutral
359
-
34,871
121,374
121,856
7.2
8.4
18.6
34.3
19.3
10.5
1.2
1.1
6.1
10.1
0.9
0.9
Oil & Gas
Cairn India
Neutral
190
-
35,660
9,127
10,632
4.3
20.6
8.8
11.7
21.6
16.3
0.7
0.7
3.3
4.2
5.3
4.4
GAIL
Neutral
388
-
49,255
56,220
65,198
9.3
10.1
27.1
33.3
14.3
11.7
1.3
1.2
9.3
10.7
1.1
0.9
ONGC
Neutral
251
-
214,999
137,222
152,563
15.0
21.8
19.5
24.1
12.9
10.4
1.1
1.0
8.5
10.1
1.8
1.6
Indian Oil Corp
Neutral
570
-
138,442
373,359
428,656
5.9
5.5
54.0
59.3
10.6
9.6
1.6
1.5
16.0
15.6
0.5
0.4
Reliance Industries
Neutral
1,076
-
348,774
301,963
358,039
12.1
12.6
87.7
101.7
12.3
10.6
1.3
1.1
10.7
11.3
1.6
1.3
Pharmaceuticals
Alembic Pharma
Neutral
657
-
12,385
3,483
4,083
20.2
21.4
24.3
30.4
27.0
21.6
6.2
4.9
25.5
25.3
3.3
2.8
Aurobindo Pharma
Accumulate
786
877
45,968
15,720
18,078
23.7
23.7
41.4
47.3
19.0
16.6
4.9
3.9
29.6
26.1
3.1
2.7
Aventis*
Neutral
4,299
-
9,901
2,357
2,692
17.3
17.3
153.5
169.2
28.0
25.4
4.8
3.8
25.8
28.4
3.9
3.2
Cadila Healthcare
Neutral
387
-
39,598
11,126
13,148
22.0
22.0
17.1
20.0
22.6
19.3
5.8
4.6
28.8
26.6
3.5
2.9
Cipla
Reduce
592
490
47,599
15,378
18,089
17.4
18.4
21.6
27.2
27.4
21.8
3.6
3.1
13.7
15.2
3.2
2.6
Stock Watch
September 19, 2016
Company Name
Reco
CMP
Target
Mkt Cap
Sales ( Čcr )
OPM(%)
EPS (Č)
PER(x)
P/BV(x)
RoE(%)
EV/Sales(x)
(Č)
Price ( Č)
( Č cr )
FY17E FY18E
FY17E
FY18E
FY17E
FY18E
FY17E
FY18E
FY17E
FY18E
FY17E
FY18E
FY17E
FY18E
Pharmaceuticals
Dr Reddy's
Neutral
3,151
-
52,214
16,043
18,119
23.1
24.7
126.0
157.8
25.0
20.0
3.7
3.2
15.7
17.1
3.2
2.8
Dishman Pharma
Sell
187
45
3,012
1,718
1,890
22.7
22.8
9.5
11.3
19.6
16.5
1.9
1.7
10.1
10.9
2.1
1.8
GSK Pharma*
Neutral
2,840
-
24,055
3,528
3,811
16.6
18.8
51.8
59.4
54.8
47.8
14.7
14.6
26.3
30.6
6.9
6.5
Indoco Remedies
Sell
315
225
2,900
1,112
1,289
18.2
18.2
13.2
15.6
23.8
20.2
4.2
3.6
19.2
19.2
2.7
2.3
Ipca labs
Accumulate
590
613
7,441
3,303
3,799
15.3
15.3
17.3
19.7
34.1
29.9
3.0
2.7
9.1
9.4
2.3
2.0
Lupin
Buy
1,538
1,809
69,341
15,912
18,644
26.4
26.7
58.1
69.3
26.5
22.2
5.2
4.2
21.4
20.9
4.4
3.6
Sun Pharma
Buy
785
944
188,805
31,129
35,258
30.0
30.9
28.0
32.8
28.0
23.9
4.3
3.6
18.7
18.9
5.7
4.8
Power
Tata Power
Neutral
75
-
20,406
36,916
39,557
17.4
27.1
5.1
6.3
14.8
12.0
1.3
1.2
9.0
10.3
1.6
1.4
NTPC
Neutral
154
-
126,568
86,605
95,545
17.5
20.8
11.8
13.4
13.0
11.5
1.3
1.2
10.5
11.1
2.8
2.8
Power Grid
Neutral
176
-
91,841
25,763
29,762
74.3
73.1
14.8
17.3
11.9
10.2
1.9
1.6
16.9
17.5
7.9
7.5
Real Estate
Prestige Estate
Neutral
198
-
7,440
4,707
5,105
25.2
26.0
10.3
13.0
19.3
15.3
1.5
1.4
10.3
10.2
2.8
2.5
MLIFE
Buy
432
522
1,772
1,152
1,300
22.7
24.6
29.9
35.8
14.5
12.1
1.1
1.0
7.6
8.6
2.2
1.9
Telecom
Bharti Airtel
Neutral
324
-
129,316
105,086
114,808
34.5
34.7
12.2
16.4
26.5
19.7
1.8
1.7
6.8
8.4
2.1
1.8
Idea Cellular
Neutral
85
-
30,571
40,133
43,731
37.2
37.1
6.4
6.5
13.3
13.1
1.1
1.0
8.2
7.6
1.8
1.5
zOthers
Abbott India
Neutral
4,595
-
9,763
3,153
3,583
14.1
14.4
152.2
182.7
30.2
25.2
148.2
126.6
25.6
26.1
2.8
2.4
Bajaj Electricals
Accumulate
265
306
2,677
5,099
5,805
5.6
5.9
11.4
14.6
23.3
18.2
3.1
2.8
13.4
15.1
0.5
0.5
Finolex Cables
Neutral
441
-
6,751
2,883
3,115
12.0
12.1
14.2
18.6
31.1
23.7
16.5
14.5
15.8
14.6
2.0
1.8
Goodyear India*
Buy
621
684
1,433
1,598
1,704
10.4
10.2
49.4
52.6
12.6
11.8
58.1
50.9
18.2
17.0
0.5
71.9
Hitachi
#N/A
1,477
4,016
Jyothy Laboratories
Neutral
335
-
6,072
1,440
2,052
11.5
13.0
8.5
10.0
39.4
33.5
9.6
8.8
18.6
19.3
4.3
3.0
Page Industries
Neutral
14,847
-
16,560
2,450
3,124
20.1
17.6
299.0
310.0
49.7
47.9
330.7
252.4
47.1
87.5
6.6
5.2
Relaxo Footwears
Neutral
425
-
5,100
2,085
2,469
9.2
8.2
7.6
8.0
56.2
53.5
21.8
18.6
17.9
18.8
2.6
2.2
Siyaram Silk Mills
Buy
1,231
1,469
1,154
1,799
2,040
11.6
11.7
104.9
122.4
11.7
10.1
1.9
1.7
16.4
16.4
0.8
0.7
Styrolution ABS India*
Neutral
580
-
1,019
1,440
1,537
9.2
9.0
40.6
42.6
14.3
13.6
36.5
33.1
12.3
11.6
0.6
0.6
TVS Srichakra
Accumulate
2,747
2,932
2,103
2,304
2,614
13.7
13.8
231.1
266.6
11.9
10.3
308.7
243.0
33.9
29.3
0.9
0.7
HSIL
Neutral
339
-
2,451
2,384
2,515
15.8
16.3
15.3
19.4
22.2
17.5
22.0
19.0
7.8
9.3
1.2
1.1
Kirloskar Engines India
Neutral
300
-
4,343
2,554
2,800
9.9
10.0
10.5
12.1
28.6
24.8
12.0
11.3
10.7
11.7
1.3
1.1
Ltd
M M Forgings
Neutral
421
-
508
546
608
20.4
20.7
41.3
48.7
10.2
8.6
57.6
51.0
16.6
17.0
0.8
0.7
Banco Products (India)
Neutral
230
-
1,646
1,353
1,471
12.3
12.4
14.5
16.3
15.9
14.1
21.9
19.8
14.5
14.6
1.1
115.5
Stock Watch
September 19, 2016
Company Name
Reco
CMP
Target
Mkt Cap
Sales ( Čcr )
OPM(%)
EPS (Č)
PER(x)
P/BV(x)
RoE(%)
EV/Sales(x)
(Č)
Price ( Č)
( Č cr )
FY17E
FY18E
FY17E
FY18E
FY17E
FY18E
FY17E
FY18E
FY17E
FY18E
FY17E
FY18E
FY17E
FY18E
zOthers
Competent Automobiles Neutral
200
-
123
1,137
1,256
3.1
2.7
28.0
23.6
7.1
8.5
38.4
34.7
14.3
11.5
0.1
0.1
Nilkamal
Neutral
1,344
-
2,006
1,995
2,165
10.7
10.4
69.8
80.6
19.3
16.7
76.8
66.7
16.6
16.5
1.0
0.9
Visaka Industries
Neutral
195
-
310
1,051
1,138
10.3
10.4
21.0
23.1
9.3
8.4
25.0
23.4
9.0
9.2
0.6
0.5
Transport Corporation of
Neutral
196
-
1,503
2,671
2,911
8.5
8.8
13.9
15.7
14.2
12.5
1.9
1.7
13.7
13.8
0.6
0.6
India
Elecon Engineering
Accumulate
59
63
644
1,482
1,660
13.7
14.5
3.9
5.8
15.2
10.2
3.6
3.3
7.8
10.9
0.7
0.7
Surya Roshni
Neutral
200
-
876
3,342
3,625
7.8
7.5
17.3
19.8
11.6
10.1
22.0
17.6
10.5
10.8
0.5
0.5
MT Educare
Neutral
129
-
513
366
417
17.7
18.2
9.4
10.8
13.8
11.9
3.1
2.7
22.2
22.3
1.3
1.1
Radico Khaitan
Buy
108
125
1,441
1,659
1,802
13.0
13.2
6.3
7.4
17.1
14.7
1.5
1.4
8.6
9.3
1.3
1.2
Garware Wall Ropes
Neutral
519
-
1,136
873
938
12.9
13.1
30.9
34.9
16.8
14.9
2.6
2.3
15.7
15.2
1.2
1.1
Wonderla Holidays
Neutral
395
-
2,230
287
355
38.0
40.0
11.3
14.2
34.9
27.8
5.0
4.4
21.4
23.9
7.6
6.1
Linc Pen & Plastics
Neutral
281
-
416
382
420
9.3
9.5
13.5
15.7
20.9
17.9
3.6
3.1
17.1
17.3
1.2
1.0
The Byke Hospitality
Neutral
160
-
641
287
384
20.5
20.5
7.6
10.7
21.0
14.9
4.4
3.6
20.7
23.5
2.2
1.7
Interglobe Aviation
Neutral
867
-
31,239
21,122
26,005
14.5
27.6
110.7
132.1
7.8
6.6
46.9
33.5
168.5
201.1
1.5
1.1
Coffee Day Enterprises
Neutral
236
-
4,861
2,964
3,260
20.5
21.2
4.7
8.0
-
29.5
2.7
2.5
5.5
8.5
2.0
1.8
Ltd
Navneet Education
Neutral
104
-
2,476
1,062
1,147
24.0
24.0
6.1
6.6
17.1
15.7
3.5
3.1
20.6
19.8
2.4
2.2
Navkar Corporation
Buy
200
265
2,848
408
612
42.9
42.3
6.8
11.5
29.5
17.4
2.0
1.8
6.9
10.5
7.7
5.2
UFO Moviez
Neutral
466
-
1,285
619
685
33.2
33.4
30.0
34.9
15.5
13.4
2.2
1.9
13.8
13.9
1.6
1.3
VRL Logistics
Neutral
295
-
2,687
1,902
2,119
16.7
16.6
14.6
16.8
20.2
17.5
4.4
3.9
21.9
22.2
1.5
1.3
Team Lease Serv.
Neutral
1,098
-
1,877
3,229
4,001
1.5
1.8
22.8
32.8
48.2
33.4
5.2
4.5
10.7
13.4
0.5
0.4
S H Kelkar & Co.
Neutral
312
-
4,511
1,036
1,160
15.1
15.0
6.1
7.2
51.1
43.5
5.5
5.0
10.7
11.5
4.1
3.6
Quick Heal
Neutral
227
-
1,587
408
495
27.3
27.0
7.7
8.8
29.3
25.8
2.7
2.7
9.3
10.6
3.0
2.5
Narayana Hrudaya
Neutral
320
-
6,546
1,873
2,166
11.5
11.7
2.6
4.0
121.1
80.8
7.4
6.7
6.1
8.3
3.5
3.0
Manpasand Bever.
Neutral
709
-
3,550
836
1,087
19.6
19.4
16.9
23.8
42.0
29.8
5.0
4.4
12.0
14.8
4.0
3.0
Parag Milk Foods
Neutral
335
-
2,816
1,919
2,231
9.3
9.6
9.5
12.9
35.4
25.9
5.5
4.5
15.5
17.5
1.6
1.4
Mirza International
Buy
90
113
1,083
1,024
1,148
18.0
18.0
6.9
8.0
13.0
11.3
2.2
1.9
16.6
16.2
1.2
1.1
Source: Company, Angel Research; Note: *December year end; #September year end; &October year end; Price as on September 16, 2016
Market Outlook
September 19, 2016
Research Team Tel: 022 - 39357800
DISCLAIMER
Angel Broking Private Limited (hereinafter referred to as “Angel”) is a registered Member of National Stock Exchange of India
Limited,Bombay Stock Exchange Limited and Metropolitan Stock Exchange Limited. It is also registered as a Depository Participant with
CDSL and Portfolio Manager with SEBI. It also has registration with AMFI as a Mutual Fund Distributor. Angel Broking Private Limited is a
registered entity with SEBI for Research Analyst in terms of SEBI (Research Analyst) Regulations, 2014 vide registration number
INH000000164. Angel or its associates has not been debarred/ suspended by SEBI or any other regulatory authority for accessing
/dealing in securities Market. Angel or its associates/analyst has not received any compensation / managed or
co-managed public offering of securities of the company covered by Analyst during the past twelve months.
This document is solely for the personal information of the recipient, and must not be singularly used as the basis of any investment
decision. Nothing in this document should be construed as investment or financial advice. Each recipient of this document should make
such investigations as they deem necessary to arrive at an independent evaluation of an investment in the securities of the companies
referred to in this document (including the merits and risks involved), and should consult their own advisors to determine the merits and
risks of such an investment.
Reports based on technical and derivative analysis center on studying charts of a stock's price movement, outstanding positions and
trading volume, as opposed to focusing on a company's fundamentals and, as such, may not match with a report on a company's
fundamentals. Investors are advised to refer the Fundamental and Technical Research Reports available on our website to evaluate the
contrary view, if any.
The information in this document has been printed on the basis of publicly available information, internal data and other reliable
sources believed to be true, but we do not represent that it is accurate or complete and it should not be relied on as such, as this
document is for general guidance only. Angel Broking Pvt. Limited or any of its affiliates/ group companies shall not be in any way
responsible for any loss or damage that may arise to any person from any inadvertent error in the information contained in this report.
Angel Broking Pvt. Limited has not independently verified all the information contained within this document. Accordingly, we cannot
testify, nor make any representation or warranty, express or implied, to the accuracy, contents or data contained within this document.
While Angel Broking Pvt. Limited endeavors to update on a reasonable basis the information discussed in this material, there may be
regulatory, compliance, or other reasons that prevent us from doing so.
This document is being supplied to you solely for your information, and its contents, information or data may not be reproduced,
redistributed or passed on, directly or indirectly.
Neither Angel Broking Pvt. Limited, nor its directors, employees or affiliates shall be liable for any loss or damage that may arise from
or in connection with the use of this information.